

High frequency data refers to time-series data collected at a fine scale. They are largely used in financial analysis and in high frequency trading, high frequency data provides intraday observations that can be used to understand market behaviours, dynamics, and micro-structures. Statistically, the higher the number of independently measured observations, the higher is the degrees of freedom, which implies more accurate estimators.
Why do we look at high frequency data?
Investors are able to get a more timely snapshot of the U.S. economy during the fast-moving coronavirus pandemic using high-frequency data.
Examples of high-frequency data:
- Weekly jobless claim
- Change in job post duration in the U.S. due to COVID-19
- Weekly Economic Index (WEI)
Weekly jobless claim
U.S. Department of Labour’s Weekly Jobless Claim published every Thursday morning is a timely official data on the state of U.S. employment.
Weekly jobless claim for the week ending August 14
Seasonally adjusted data:
- The advance figure for seasonally adjusted initial claims was 348,000, a decrease of 29,000 from the previous week’s revised level.
- This is the lowest level for initial claims since March 14, 2020 when it was 256,000.
- The previous week’s level was revised up by 2,000 from 375,000 to 377,000.
- The 4-week moving average was 377,750, a decrease of 19,000 from the previous week’s revised average.
- This is the lowest level for this average since March 14, 2020 when it was 225,500.
- The previous week’s average was revised up by 500 from 396,250 to 396,750.
- The advance seasonally adjusted insured unemployment rate was 2.1 percent for the week ending August 7, unchanged from the previous week’s unrevised rate
- The adjusted insured unemployment during the week ending August 7 was 2,820,000, a decrease of 79,000 from the previous week’s revised level
- . This is the lowest level for insured unemployment since March 14, 2020 when it was 1,770,000.
- The previous week’s level was revised up 33,000 from 2,866,000 to 2,899,000.
- The 4-week moving average was 2,998,750, a decrease of 110,500 from the previous week’s revised average.
- This is the lowest level for this average since March 21, 2020 when it was 2,071,750.
- The previous week’s average was revised up by 8,250 from 3,101,000 to 3,109,250.

Unadjusted data
- The advance number of actual initial claims under state programs, unadjusted, totalled 308,574 in the week ending August 14, a decrease of 14,469 (or -4.5 percent) from the previous week.
- There were 879,545 initial claims in the comparable week in 2020.
- In addition, for the week ending August 14, 44 states reported 109,379 initial claims for Pandemic Unemployment Assistance.
- The advance unadjusted insured unemployment rate was 2.0 percent during the week ending August 7, a decrease of 0.1 percentage point from the prior week.
- The advance unadjusted level of insured unemployment in state programs totaled 2,763,782, a decrease of 86,599 (or -3.0 percent) from the preceding week.
- The seasonal factors had expected a decrease of 8,229 (or -0.3 percent) from the previous week.
- A year earlier the rate was 9.7 percent and the volume was 14,155,552.
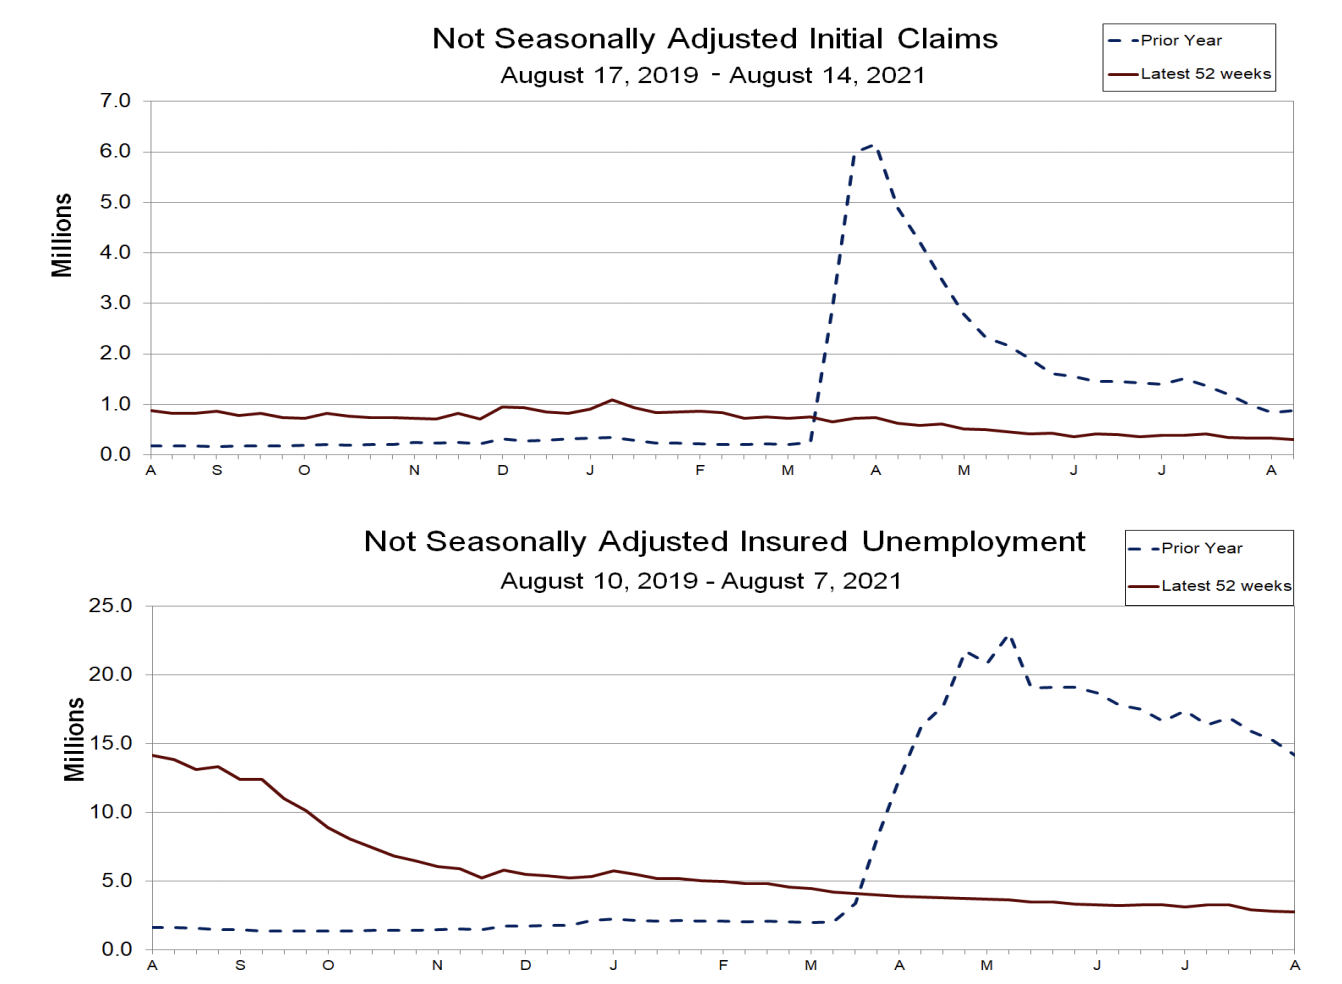
- The total number of continued weeks claimed for benefits in all programs for the week ending July 31 was 11,743,515, a decrease of 311,787 from the previous week.
- There were 28,676,558 weekly claims filed for benefits in all programs in the comparable week in 2020.
Change in job post duration in the U.S. due to COVID-19
Job post duration, which measures how many days it takes to fill positions, provides an indication of how hard it is for employers to find qualified candidates
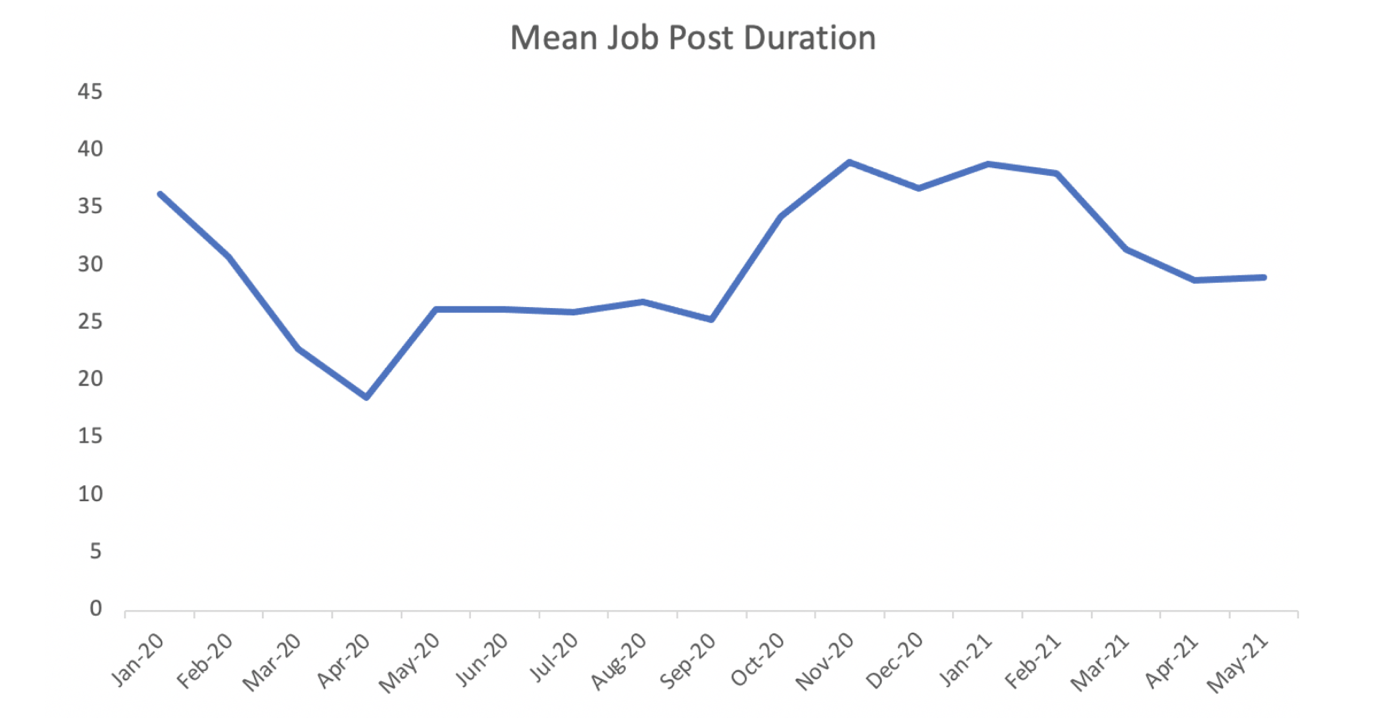
- The initial drop in job post duration at the start of 2020 is caused by the start of the pandemic and the seasonal reduction in hiring after the year-end holidays.
- The lowest job posting duration was in April 2020 (18.6 days), occurring the month after lockdowns.
- The duration of job postings increased at the end of 2020 and the start of 2021, in part due to seasonal businesses hiring during the holidays.
- As the vaccine rollout ramped up in February 2021 and peaked April 2021, the economy improved.
Weekly Economic Index (WEI)
The WEI is an index of real economic activity using timely and relevant high-frequency data. It represents the common component of ten different daily and weekly series covering consumer behavior, the labor market, and production
The WEI is composed of ten underlying series, data included in WEL calculation are:
- Measure consumer behaviour: the Redbook same-store retail sales index and the Rasmussen Consumer Index are included.
- Measure labour market conditions: initial and continuing unemployment insurance claims, the American Staffing Association Index of temporary and contract employment, and federal tax withholding data from Booth Financial Consulting.
- For production: U.S. steel production from the American Iron and Steel Institute, U.S. electricity output data from the Edison Electric Institute,
- a measure of fuel sales based on Energy Information Administration data, and total railroad traffic from the Association of American Railroads.
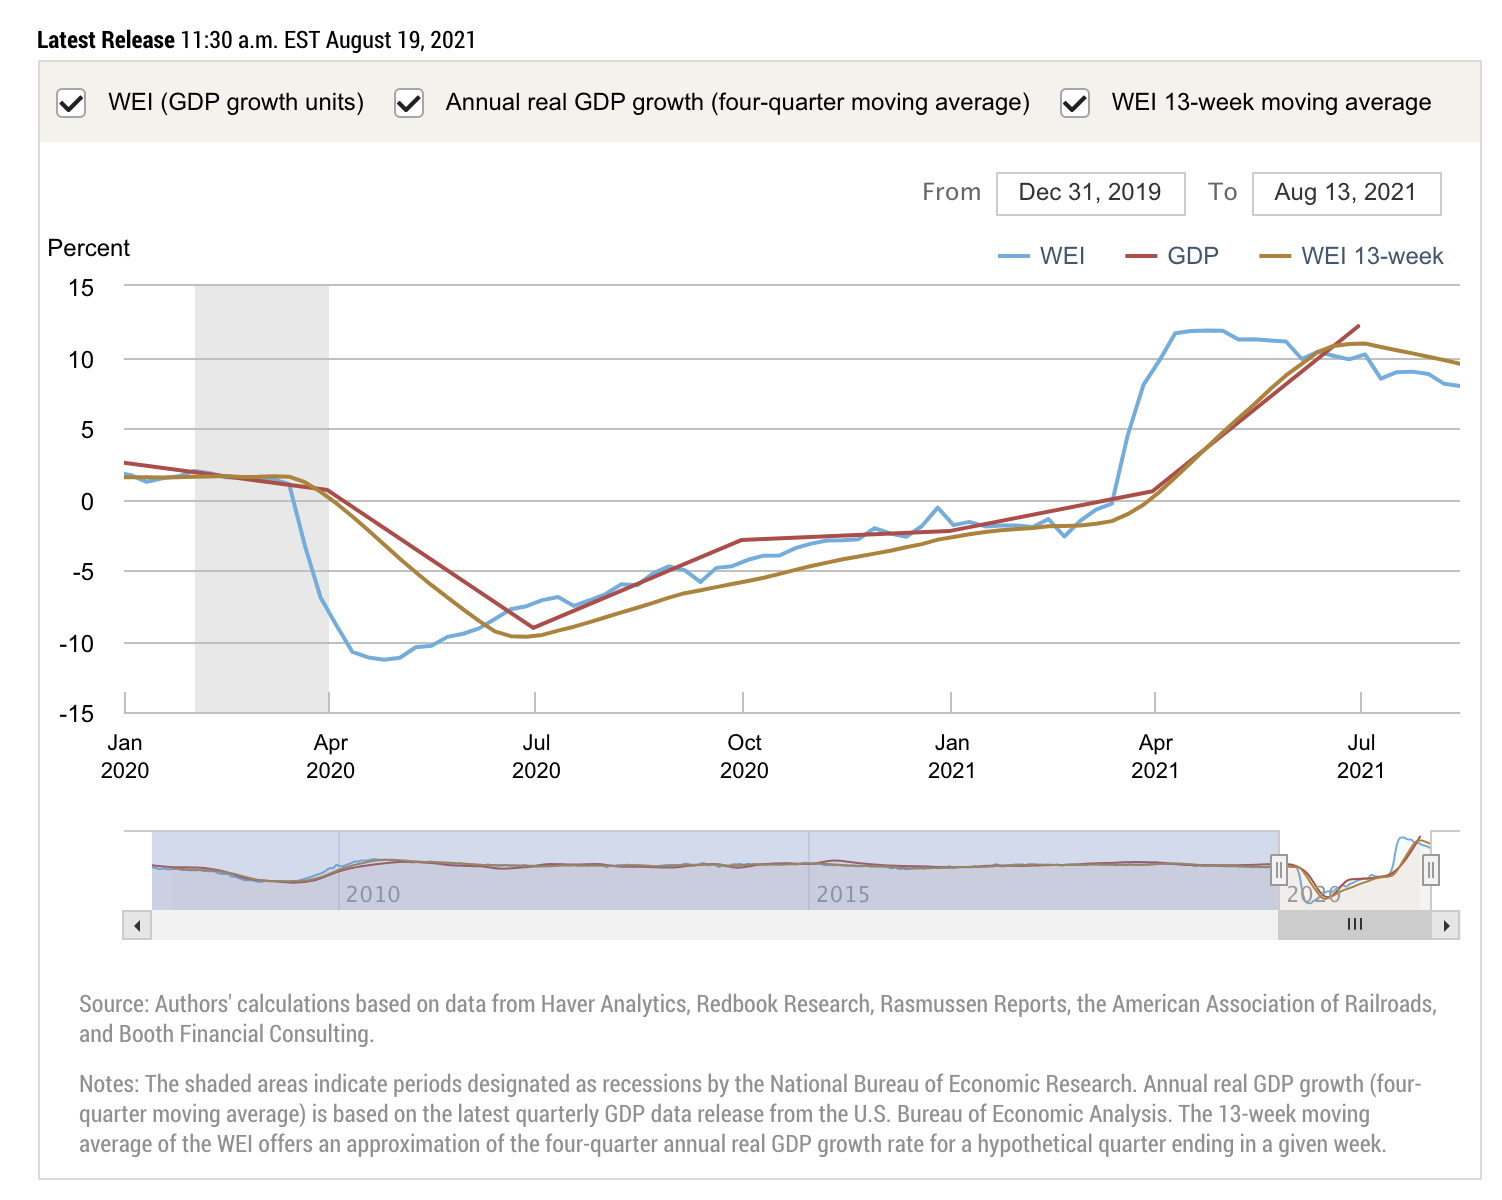
Key findings:
- The decline in the WEI for the week of August 14 (relative to the final estimate for the week of August 7) is due to a decrease in rail traffic, which more than offset increases in tax withholding, fuel sales, and electricity output and a fall in initial unemployment insurance claims.
- Because the WEI measures changes over a 52-week period, the large positive reading also reflects the sharp deterioration in economic conditions during the same time last year.
Reference:
Factbox: High-frequency data source for the U.S. pandemic economy, Reuters, https://www.reuters.com/article/us-usa-economy-data-factbox-idUSKBN25G1ZX
High frequency data, Wikipedia https://en.wikipedia.org/wiki/High_frequency_data#cite_note-:3-4
Unemployment Insurance Weekly Claim, United State Department of Labour
https://www.dol.gov/ui/data.pdf
Weekly Economic Index (WEI), Federal Reserve Bank of New York,
https://www.newyorkfed.org/research/policy/weekly-economic-index#/interactive
Change in job post duration in the U.S. due to COVID-19, Adam Halawa, Chmura,