

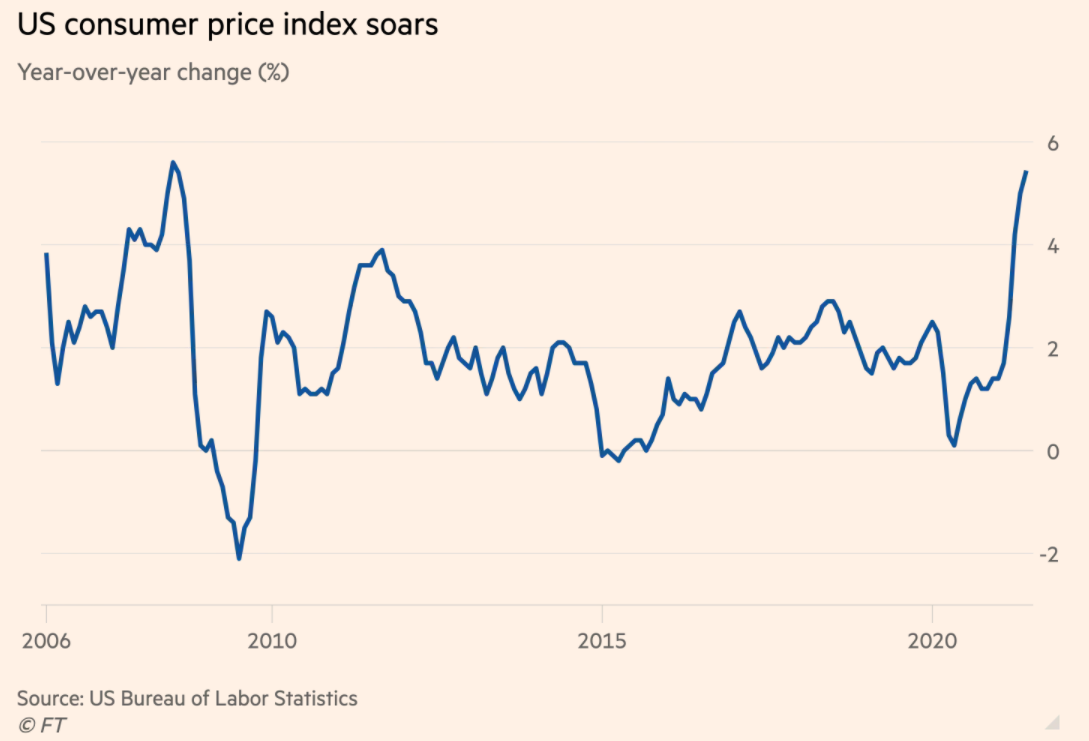
In the previous article, we (CAFX) had run a detailed analysis of why the Fed has now forced itself into a corner, facing in between of a rock and a hard place. On the one hand, the Fed continues to purchase $120 billion USD worth of Treasury Bonds and ABSs monthly plus near zero interest rate, together with the other major central banks, flooding the market with significant amount of liquidity; on the other hand, excessive monetary and fiscal supports, supply chain bottleneck and recent disruption as well as “revenge consumption” all result in an once-in-a-generation event of high inflationary pressure. To make things worse, there is now uncertainty of the Delta virus which could potentially jeopardise the economic recovery in the major OECD countries. FOMC which is the decision body in making the monetary policy, is now divided with 3 major camps, Hawks, Doves and the Centrists, including Chairman Powell himself, believes the current inflation is only transitory, putting off calls of having concrete actions in tapering the scale existing monthly asset changes. Once again, we would like to emphasize this is tapering, not asset reduction nor quantitative tightening. Despite the previous experience of “taper tantrum”, we remain confident the level of monetary support from the FOMC is excessive.
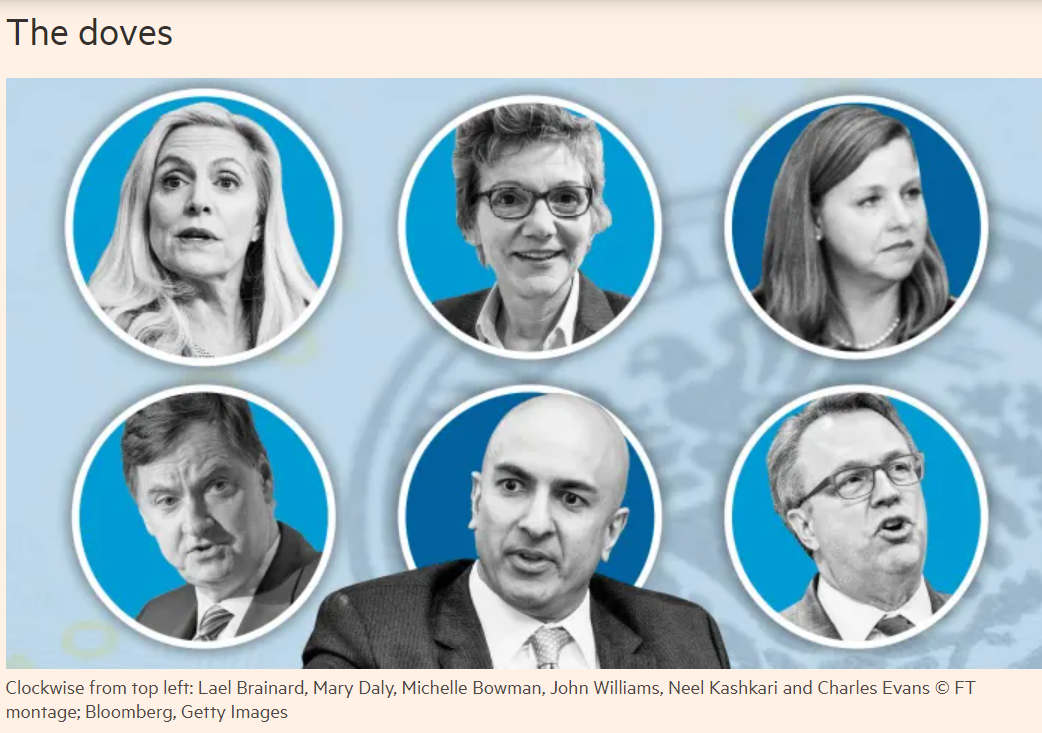
- FOMC Doves: lead by Neel Kashkari, remains indifferent to current high level of inflation and wants to see more recovery in job market
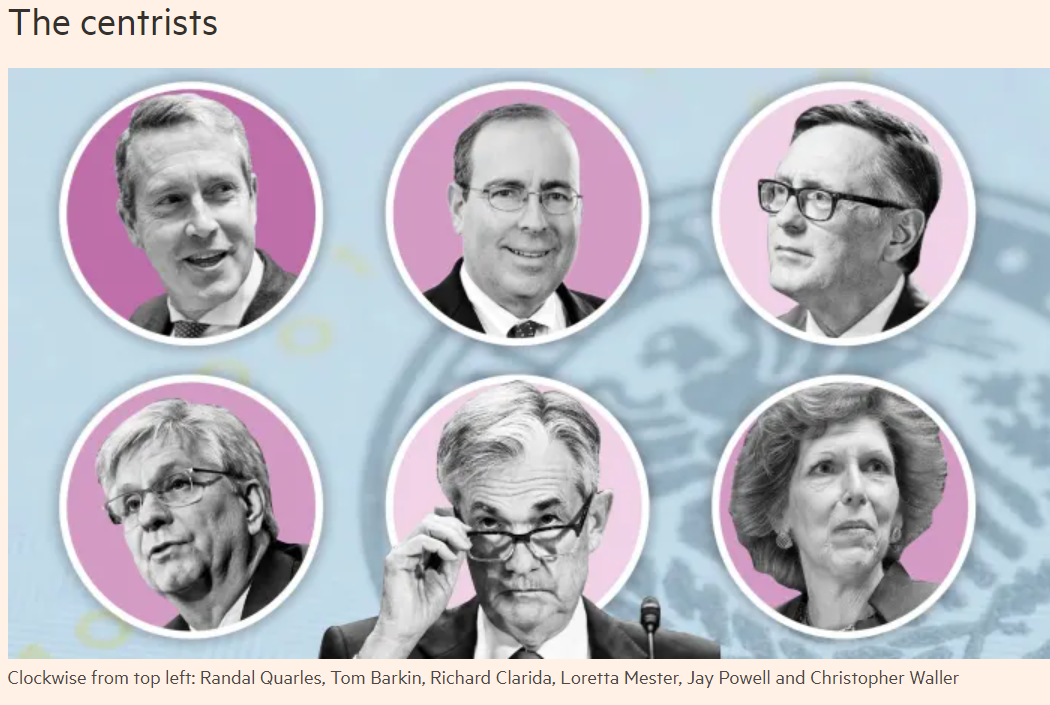
- The Centrists: lead by Powell, is considering tapering later this year
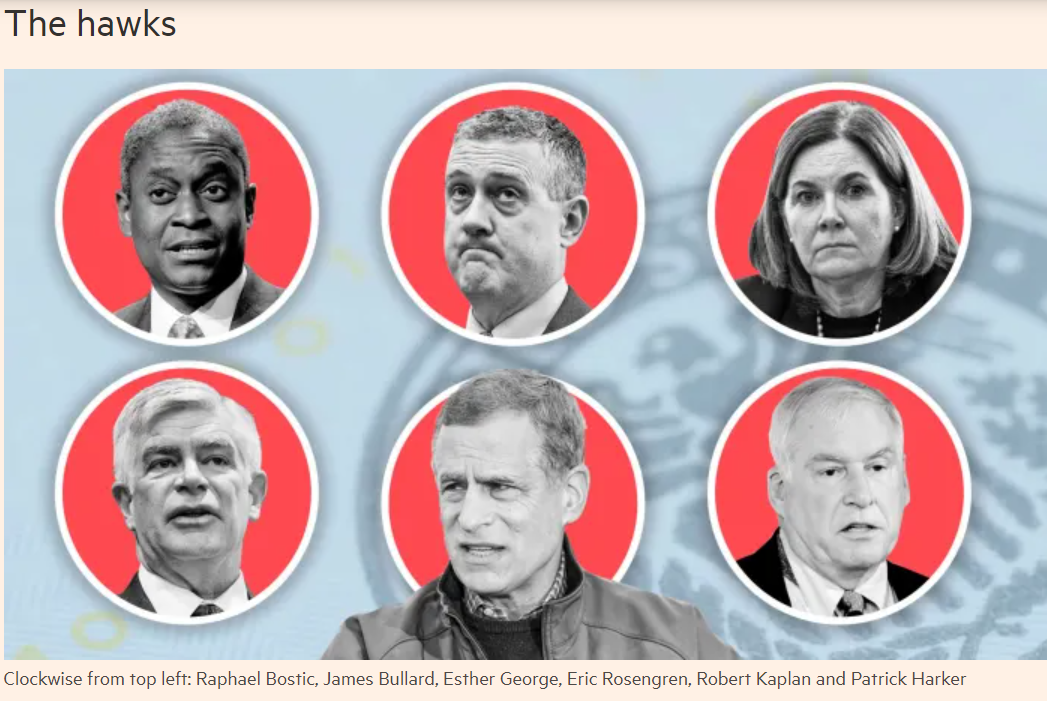
- Hawkes, lead by Bullard and Kaplan, prefer the withdraw of current large monthly asset purchase as soon as possible
We will need to see a persistently high level of PCE index in the coming months in order to swing the Centrists across the Hawks camp which would mean a concrete plan of tapering in the coming FOMC meetings. since 2012, FOMC has viewed PCE index a more reliable gauge on inflation pressure. Subsequently for today’s article, we will deep dive into the PCE, what is PCE index, how it is surveyed and calculated and what is the latest PCE number. ‘
Personal Consumption Expenditure (PCE)
Personal Consumption Expenditures (PCEs) are defined as a measure of imputed household expenditures over a period of time. It includes the amount of money that is spent on durable and non-durable goods, as well as services. Personal income shows how much money consumers earn and personal consumption expenditures are a measure of the outlays or how much consumers spend.
In 2012, the Personal Consumption Expenditure Index, or PCE index became the primary inflation index used by the U.S. Federal Reserve in monetary policy decisions. PCE index is a measure of the changing prices of goods and services purchased by consumers in the United States. The PCE price is also a measure of inflation (or deflation) across a wide range of consumer expenses and it reflecting changes in consumer behavior. For example, if the price of beef rises, shoppers may buy less beef and more chicken. The PCE price index is used primarily for macroeconomic analysis and forecasting.
Personal Income and Outlay
The Personal Income and Outlays report, also known as the Personal Consumption Report) is produced by the Bureau of Economic Analysis (BEA) which aims to track consumer income and spending. Personal income is the dollar value of income from all sources by individuals in the U.S.; personal outlay is the dollar value of purchases of durable, and non-durable goods and services by U.S. consumers. This data is an indicator that shows consumer behavior, saving activity, and overall economic performance.
Current PCE data
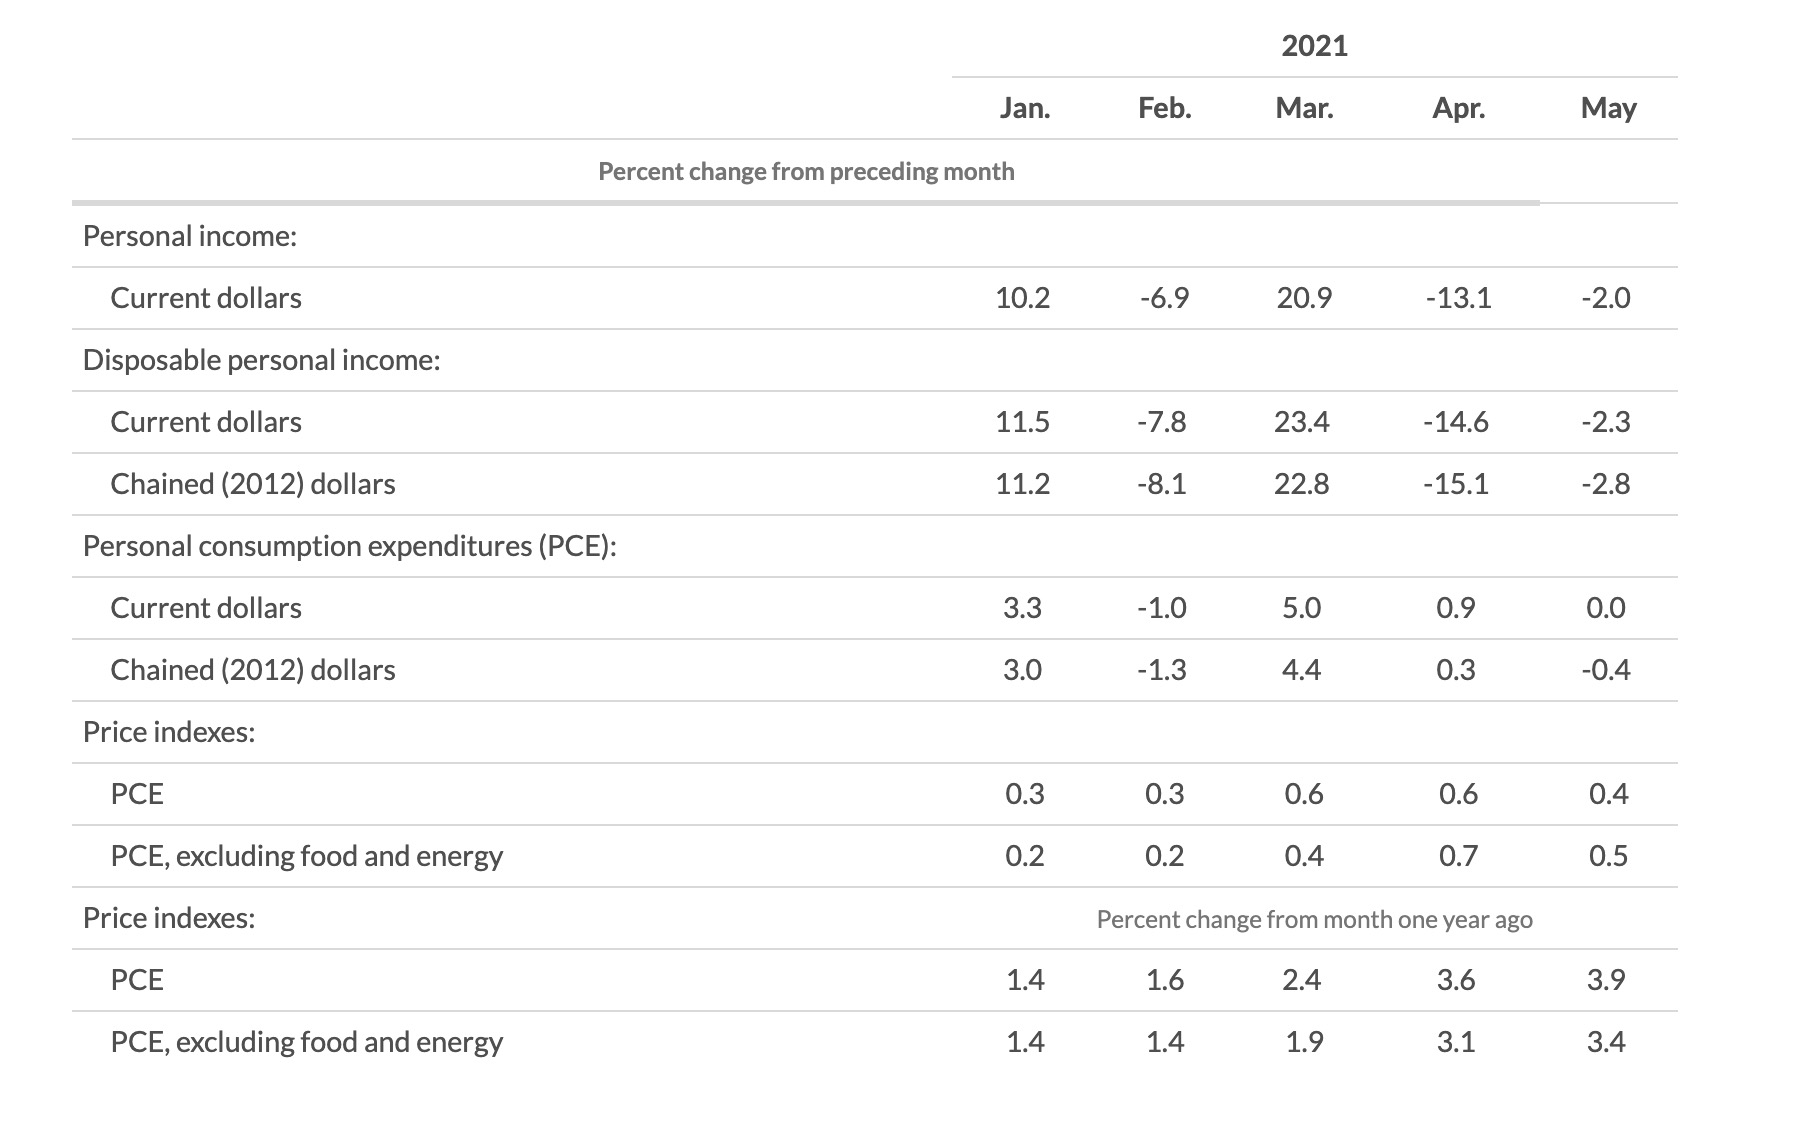
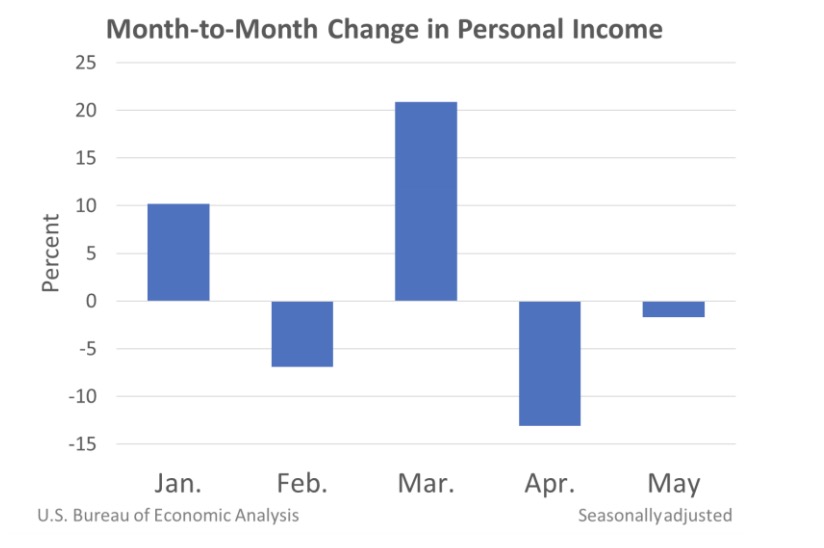
According to the Bureau of Economic Analysis, personal income decreased $414.3 billion (2.0 percent) in May and disposable personal income (DPI) decreased $436.3 billion (2.3 percent). Personal consumption expenditures (PCE) on the other hand, increased $2.9 billion (less than 0.1 percent).
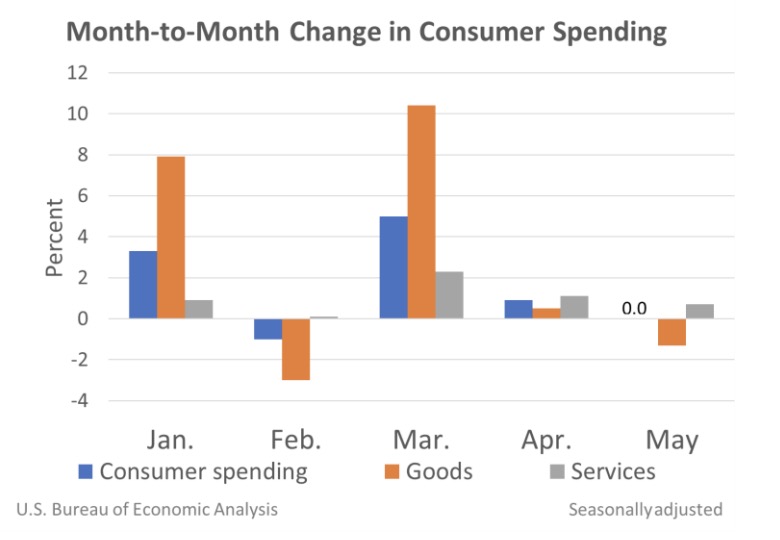
Real DPI decreased 2.8 percent in May and Real PCE decreased 0.4 percent; goods decreased 2.0 percent and services increased 0.4 percent. The PCE price index increased 0.4 percent. The PCE price index increased 0.5 percent when food and energy are excluded.
Definitions:
- Personal income is the income received by a person from all sources: from participation as laborers in production, from owning a home or business, from the ownership of financial assets, and from government and business in the form of transfers. It includes income from domestic sources as well as the rest of the world. It does not include realized or unrealized capital gains or losses.
- Disposable personal income is the income available to persons for spending or saving. It is equal to personal income less personal current taxes.
- Personal consumption expenditures (PCE) is the value of the goods and services purchased by the United States residents.
- Personal outlays is the sum of PCE, personal interest payments, and personal current transfer payments.
- Personal saving is personal income less personal outlays and personal current taxes. The personal saving rate is personal saving as a percentage of disposable personal income.
- Current-dollar estimates are valued at market value.
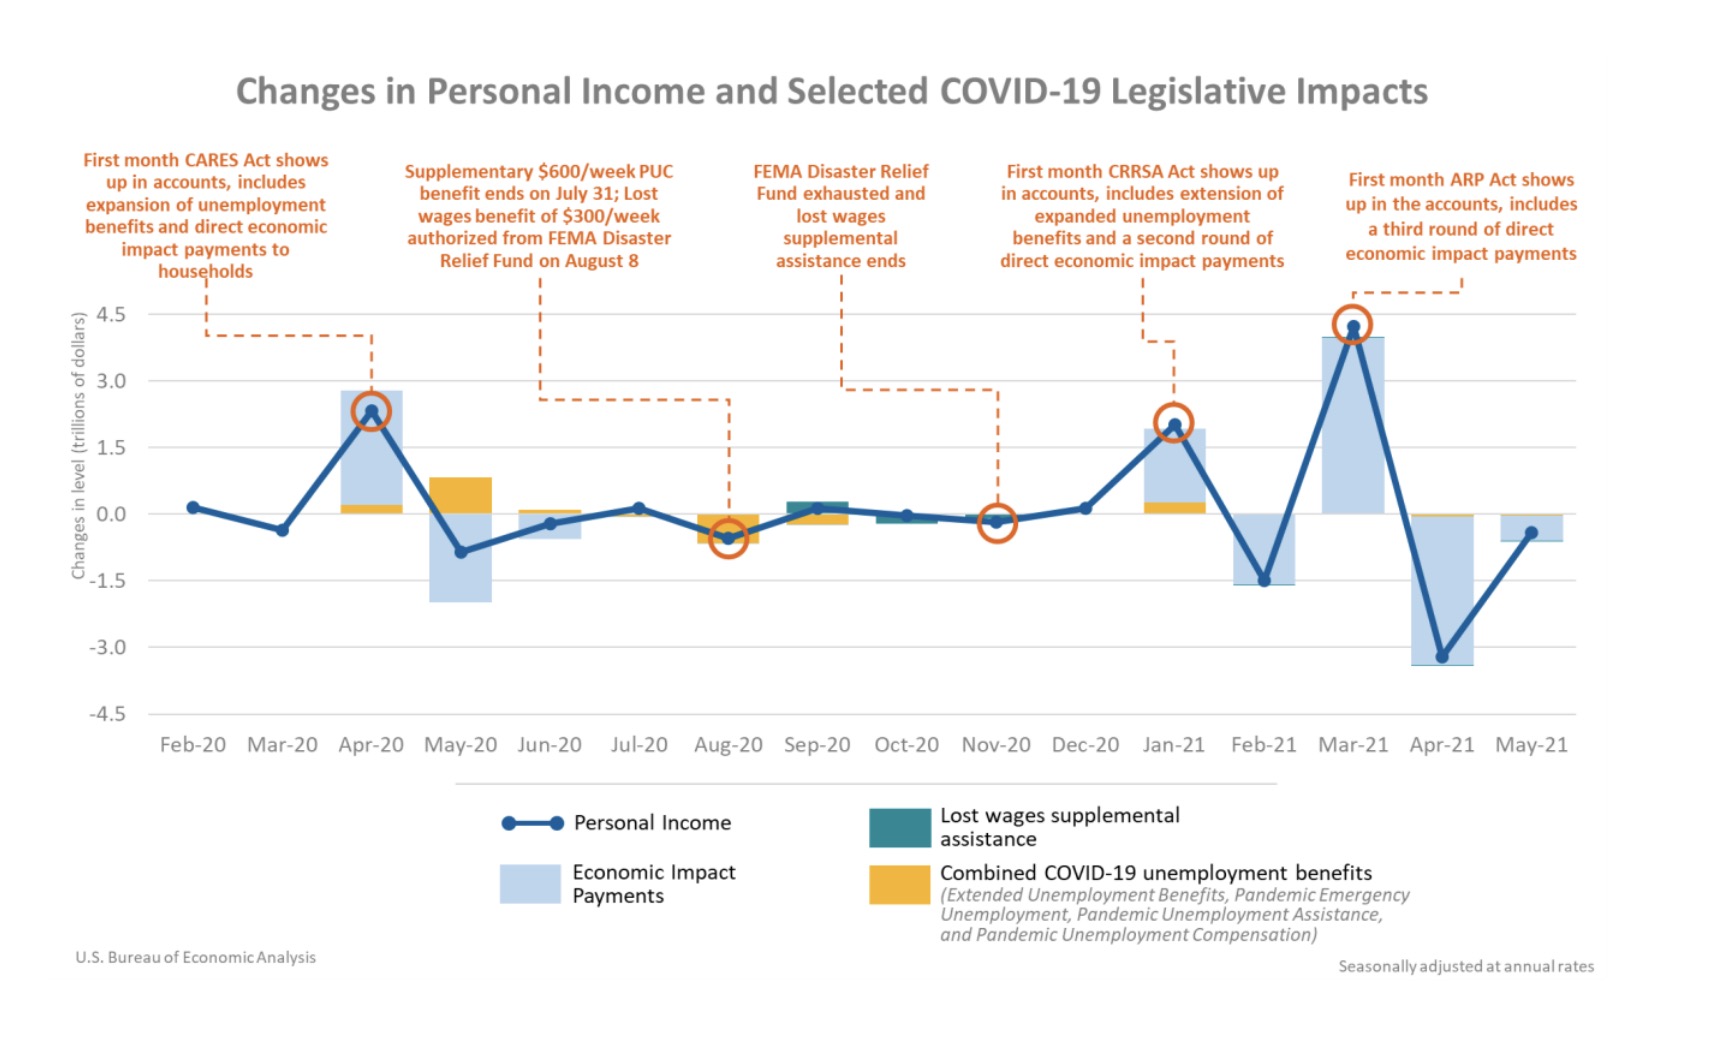
The estimate for May personal income and outlays reflected the continued economic recovery from the COVID-19 pandemic. The decrease in personal income in May primarily is due to a decrease in government social benefits. The decreases in payments from the Pandemic Unemployment Compensation program have led to a decrease in unemployment insurance.
The $2.9 billion increase in current dollar PCE in May reflected an increase of $74.3 billion in spending for services and a $71.5 billion decrease in spending for goods.
The increase in services is led by spending for recreation services, food services, and accommodations, as well as housing and utilities. While a decrease in spending on motor vehicles and parts was the leading contributor to the decrease in goods.
In May, Personal outlays increased $5.5 billion and Personal saving was $2.29 trillion in May. the personal saving rate, which is personal saving as a percentage of disposable personal income, was 12.4 percent.
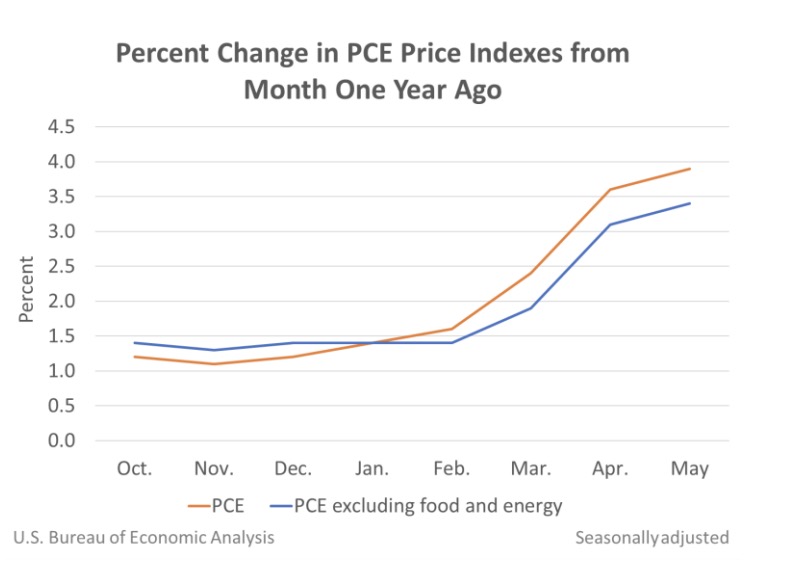
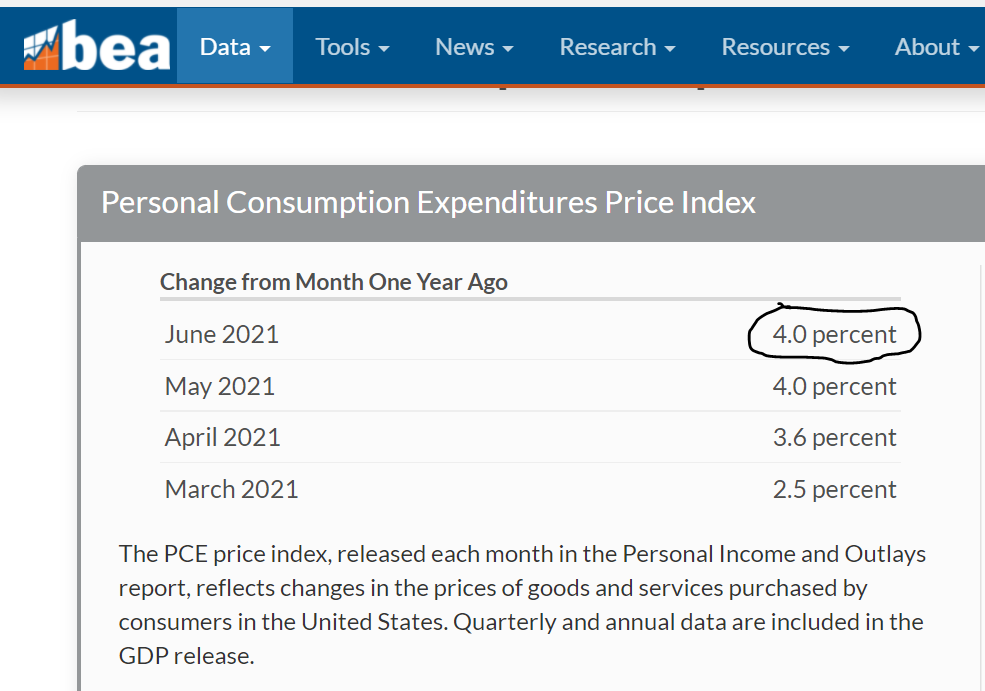
The PCE price index for May increased 3.9 percent from 2020 due to the increases in both goods and services. Energy prices increased 27.4 percent while food prices increased 0.4 percent. Excluding food and energy, the PCE price index for May increased 3.4 percent from one year ago.
Compared to April 2021, the PCE price index increased 0.4 percent due to the increases in both goods and services. Energy prices remained the same while food prices increased 0.3 percent. Excluding food and energy, the PCE price index increased 0.5 percent from April 2021 to May 2021.
The change in personal income is primarily affected by the change in government social benefits over the past 15 months.
Consumer spending comparisons to February 2020
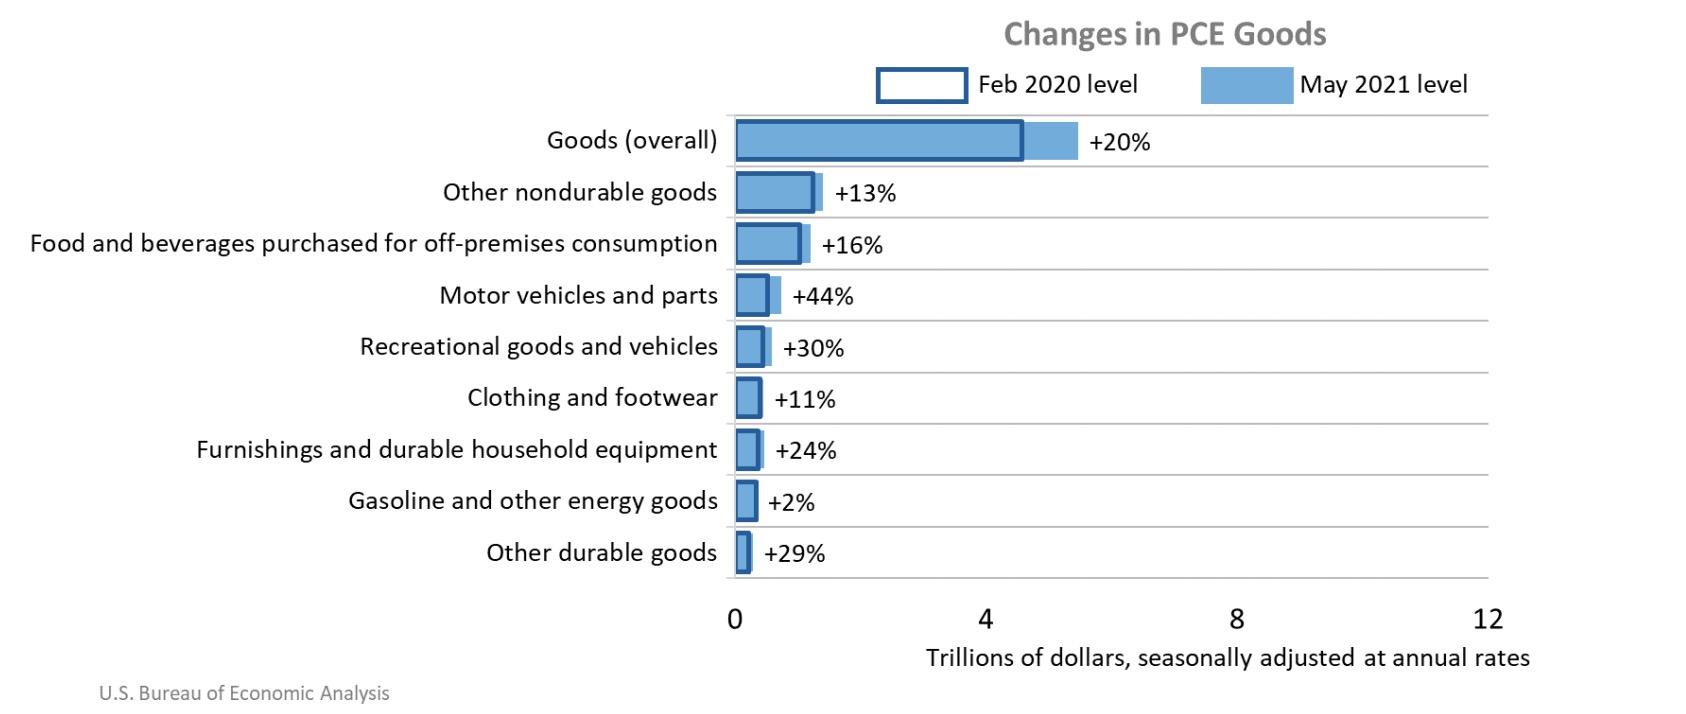
Spending for goods increased while spending for services decreased compared to May 2021.
Spending for goods in May 2021 was 20 percent above the February 2020 level. Categories including motor vehicles and parts, recreational goods and vehicles (led by information processing equipment), and furnishings and durable household equipment experienced the most significant increase.
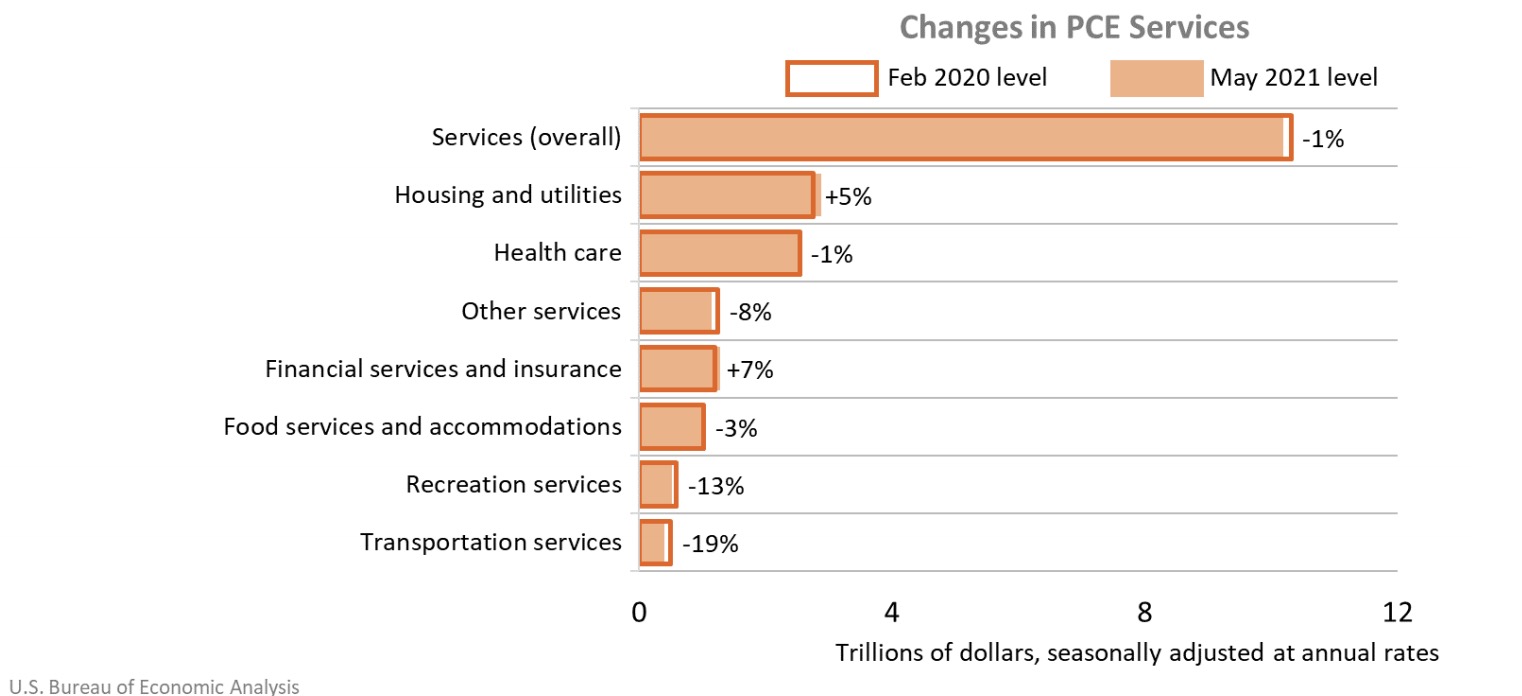
Spending for services in May 2021 was 1.0 percent less than the February 2020 level. Categories including transportation services, recreation services, and food services, and accommodations experienced a significant decrease. During the COVID-19 pandemic, these sectors were at times closed or at limited capacity
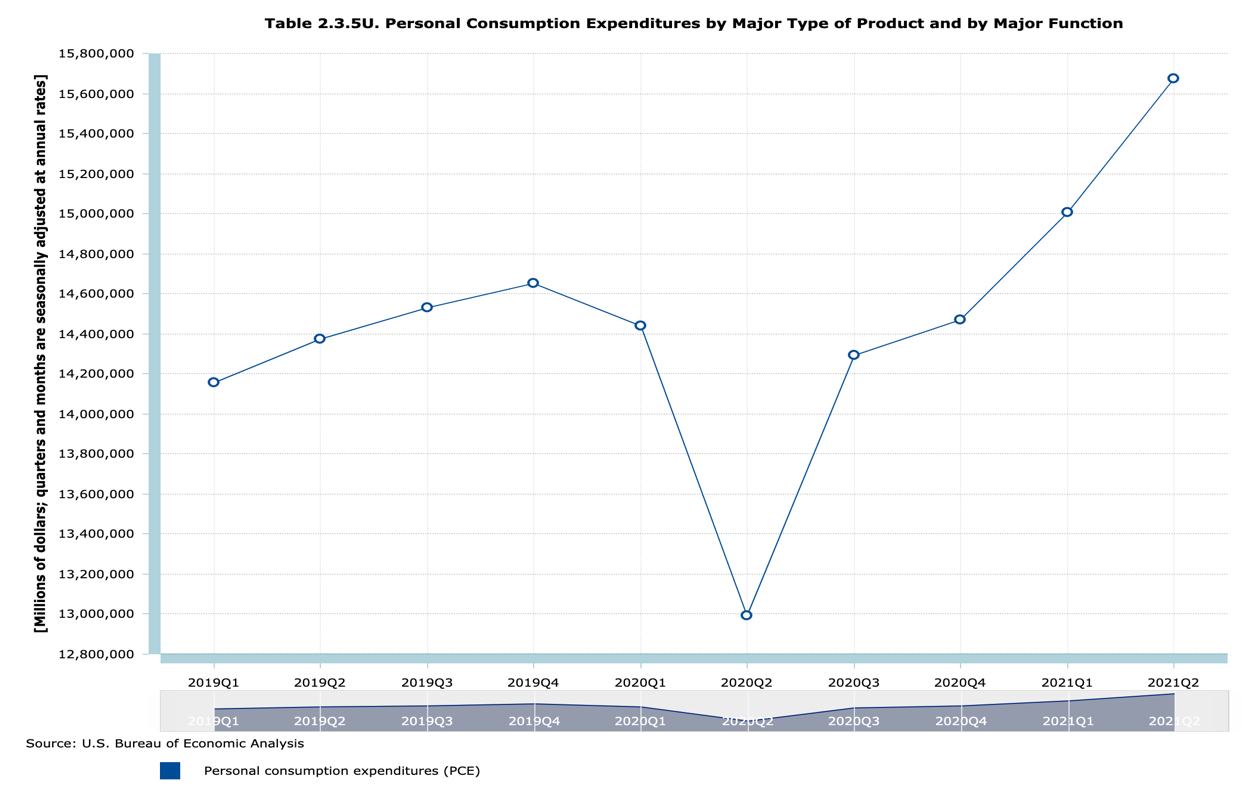
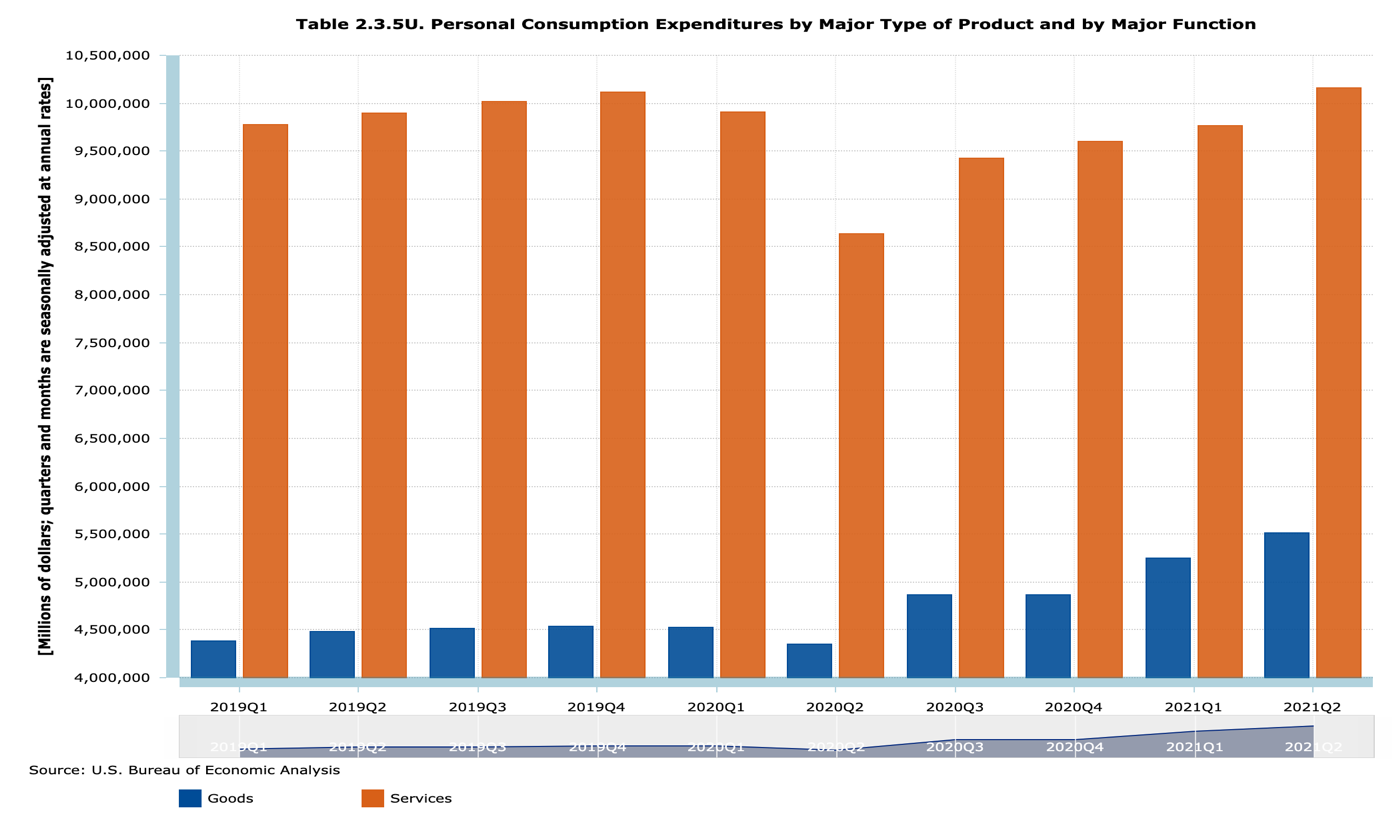
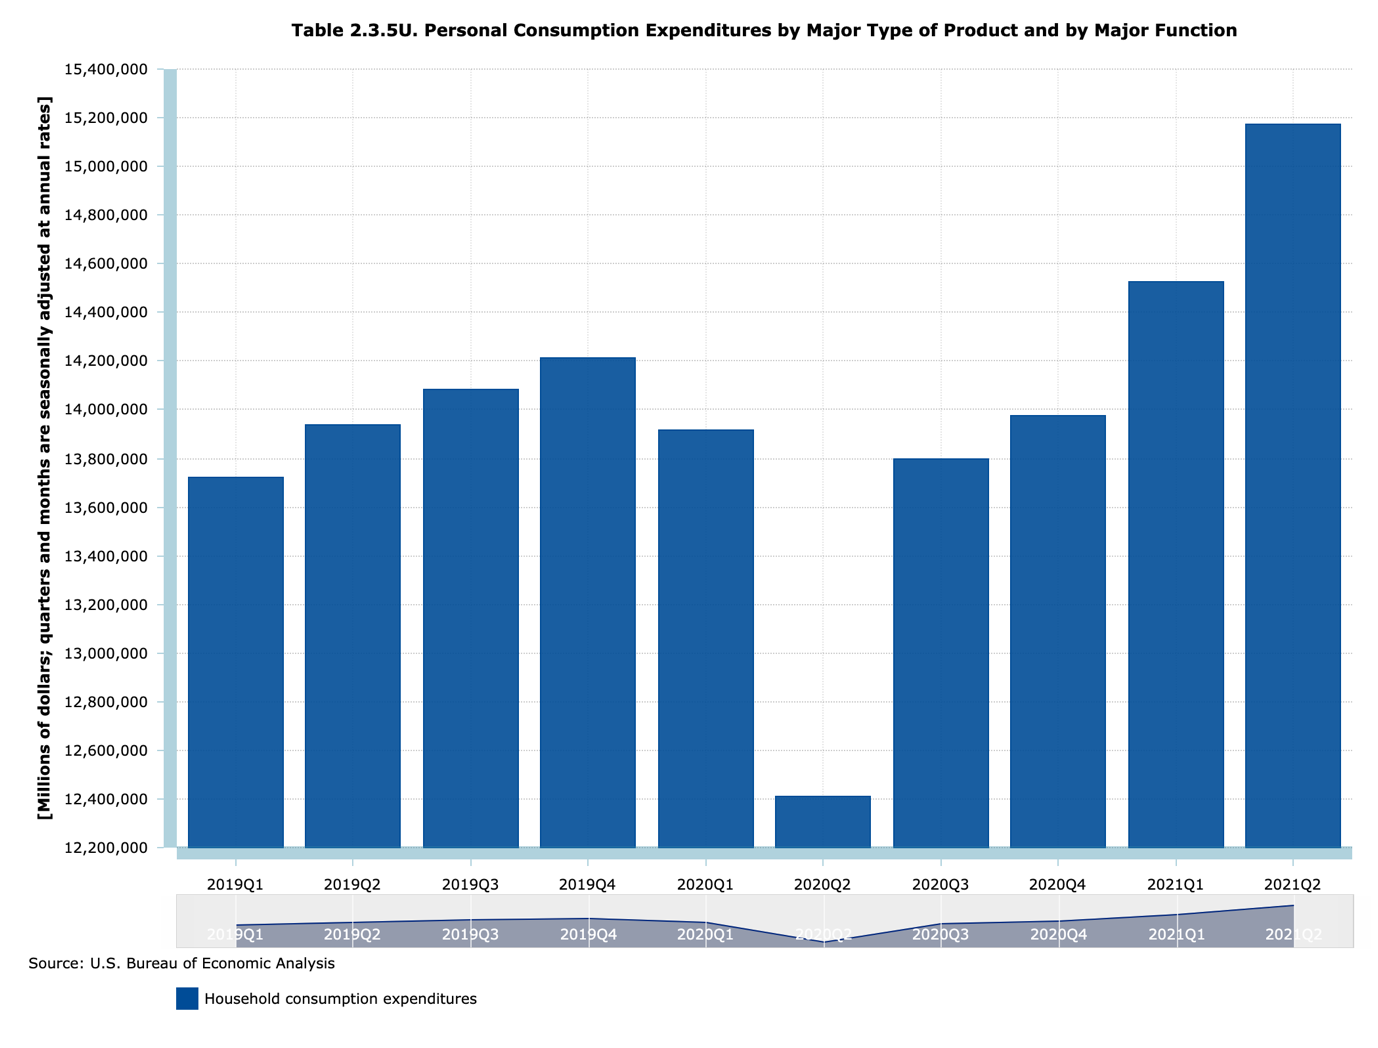
Historical charts of PCE in the U.S. from 2019 to 2021
The Personal Consumption Expenditures by all groups
The Personal Consumption Expenditures by Goods and Services
The Household consumption expenditure
Why does the Fed believe inflation is temporary?
In the July 2021 FOMC meeting, the Federal Reserve admitted inflation is higher than expected but still believes the price pressure is temperate. The labour market is still weak, the U.S. weekly jobless claims this month increased to a two-month high last week, suggesting that the labour market was still far from full employment due to the spread of the Delta variant. The initial claims for state unemployment benefits reached the highest level since mid of May, as it increased 51,000 to a seasonally adjusted 419,000 for the week ended July 17. However, the weekly jobless claims report also showed more people are returning to work, showing a trend that bodes well for July’s employment report. The U.S. employment benefit are currently increasing, which result in an increase in wage and companies are passing these costs onto consumers, leading to a rise in price.
Furthermore, the widespread of vaccination has increased economic actives. The May PCE data shows an increase in services is led by spending for recreation services, food services, and accommodations, as well as housing and utilities. Thus, the rise in price in services may due to the temporary high demand of these sectors.
The Federal Reserve Chairman Powell said the Fed looked at reducing bond purchasing and the Fed acknowledged improvement on the U.S. economy, the Central bank is not at the level where ‘substantial’ progress has been achieved.
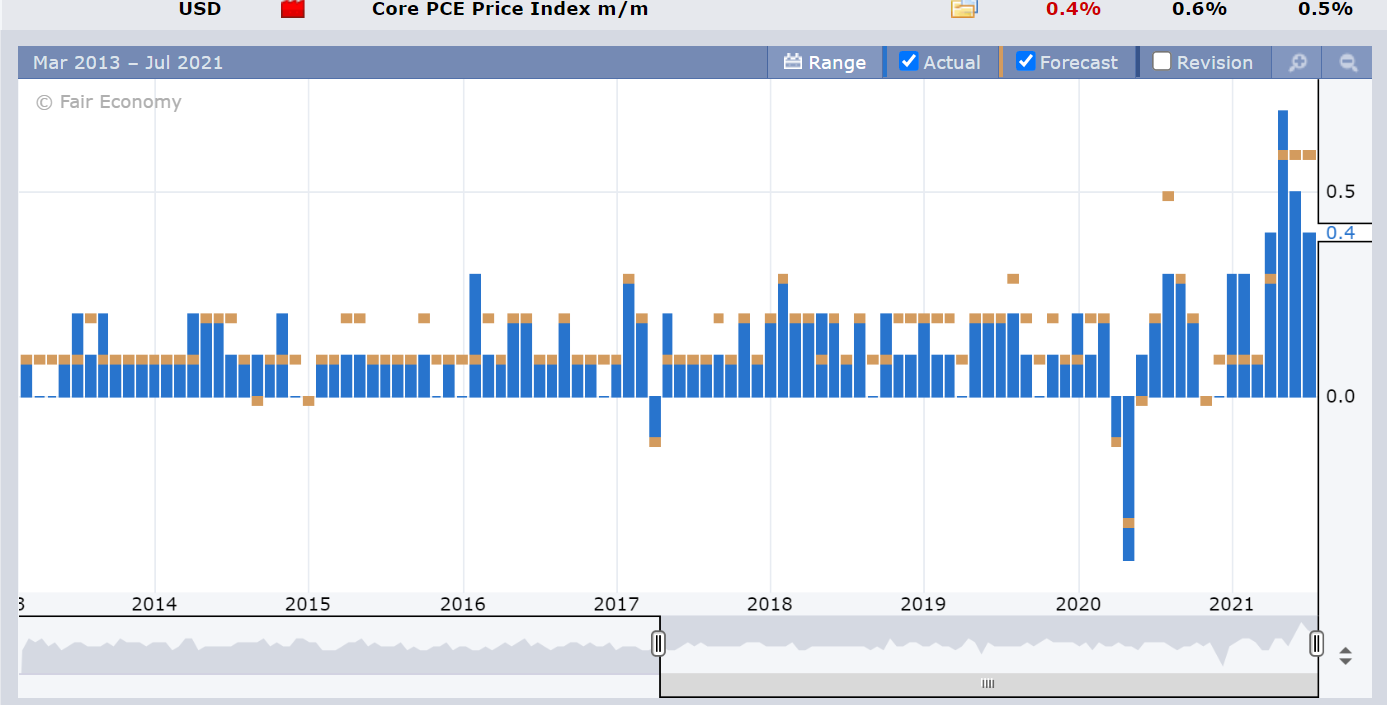
The latest Core PCE on 30 July (past Friday) release shows the month on month growth has moderated somewhat, but still stays at an elevated level of 4% compared to last year. All in all, a divided FOMC will need to see more data releases, including the PCE index, and job reports (NFP) in the coming months. Having said this, the Fed continues to be running “ahead of the pact” among the major central banks in the world when it comes to scaling back monetary support. Hence, we maintain our forecast of a stronger USD in the coming 12 months.
References:
Hawks v.s. Doves: US Fed Divided over when to Dial Back Economic Support
https://www.ft.com/content/33e420c1-9220-49c0-bc06-105eb921dfd3
Investopedia 2021, Personal Consumption Expenditures (PCE)
https://www.investopedia.com/terms/p/pce.asp
intelligencer 2021, 3 Reasons April’s Inflation Will Probably Be Temporary
https://nymag.com/intelligencer/2021/05/april-inflation-markets-federal-reserve-temporary.html
Price & Infaltion 2021, BEA
https://www.bea.gov/resources/learning-center/what-to-know-prices-inflation
Personal Income and Outlays, May 2021, BEA
https://www.bea.gov/news/2021/personal-income-and-outlays-may-2021
Personal Income and Outlays 2021, Investopedia
https://www.investopedia.com/terms/p/personal-income-outlays.asp
BEA 2021, Personal Income and Outlays,